Installing the Metrics Store on Red Hat Virtualization
Installing the Metrics Store on Red Hat Virtualization
What I did
Created a UI flow and interface for an installation process that was typically only done via the command line
Collaborated with developers and project managers to figure out the ideal flow before jumping into wireframes
Collaborated early and often with the development team who had initially written the Metrics Store installation scripts to make sure that the UI supported the backend
Iterated through many versions of the UI flow and interface until a solution was reached
Background
The Metrics Store is a plug-in that the user can install on Red Hat Virtualization to collect logs and metrics. The user can bring the collected logs and metrics data into Grafana, an analytics and interactive visualization web application, to create charts and graphs about their Red Hat Virtualization environment.
My role
UX/UI Design
Tools
Sketch, Lucidchart, Invision
Platform
Web based application
Timeline
June 2019 - September 2019
Design goal
Create a UI flow and interface that makes the Metrics Store installation process easier and more straightforward for the user to complete.
Design process
The design process for the metrics store installer started with the product team reaching out to me to design a UI to make the Metrics Store installation process more simple and straightforward. Up until this point, the installation process could only be completed via the command line. Customers were also requesting that the installation process be more straightforward and easy to complete, so it became a top priority to create a better installation experience.
Collaborating early and often with the development team who originally wrote the Metrics Store installation script was key to a successful collaboration. I worked closely with the development team to understand how the installation process worked and how we should represent it in a UI.
The command line installation process looked something like this:
As the UX designer for the team, it was my responsibility to understand the different stages and flow of the command line installation process and create a coherent and informed interface based on what’s happening on the back end.
The design process for the Metrics Store installer went like this.
Meet with the development team to understand the current command line installation process.
Create a rough draft flow of the metric store installation process. Begin to determine what should be featured in the UI.
Review the rough draft flow with the development team and get their feedback on it.
Update the flow based on their feedback.
Share an updated flow with them and get sign off from stakeholders on the flow.
Start to do rough wireframes based on the refined user flow.
Share installation wireframes and UI flow with stakeholders.
Repeatedly share wireframes, get feedback, and update the wireframes.
Reach a final iteration and share it with stakeholders.
Happy stakeholders and an improved user experience, happy designer :)
Final UI and flow
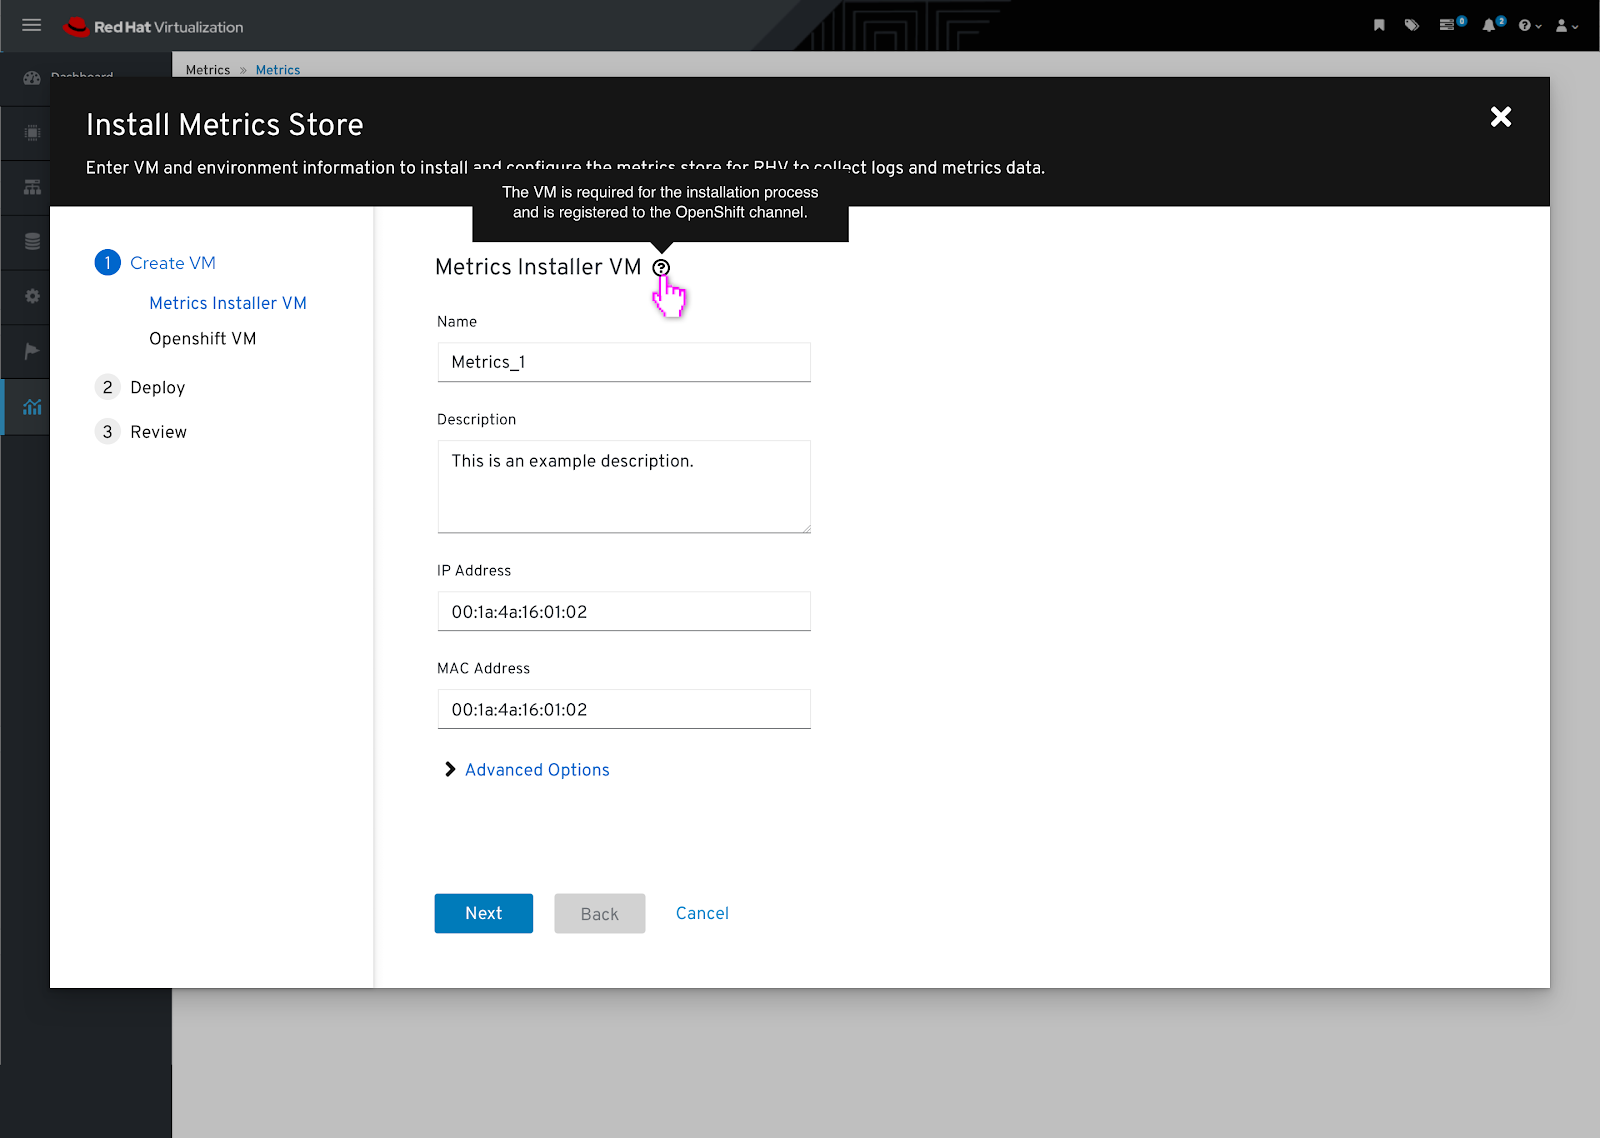
In the first step of the installation process, the user had to create specific virtual machines that would house the metrics installer. The user can define the attributes of the virtual machines.
Next, the user can select the different hosts they would like the virtual machines to run on.
Finally, the user can review the virtual machine and host information they selected in the previous screens before beginning the installation process.
What I learned
Figure out the flow before jumping into wireframes. If you have a strong, foundational flow to work off of it makes the process of iterating through wireframes much smoother.
Talk and listen to experts to learn more. Meeting and collaborating with the development team who originally wrote the installation scripts was essential to creating the UI.